Qualitative Data Analysis: Methods, Process, and Examples
Most impact-focused organizations (nonprofits, foundations, and impact investors) don't have a shortage of stories. They have ample opportunities to collect qualitative data through interviews, open-ended survey responses, and narrative reports throughout the year. The hard part is turning that data into evidence a board or funder can trust.
That's the job of qualitative data analysis. Taking a strategic approach to qualitative analytics allows impact organizations to understand their non-numerical data and use it to add dimension to their impact reporting, which is essential for securing funding and justifying decisions to investors.
This guide covers everything you need to improve your qualitative impact analysis. We'll cover:
- Qualitative Data Analysis FAQs
- Qualitative Data Analysis Methods
- How to Analyze Qualitative Data
- Best Practices for Qualitative Data Analysis
Qualitative Data Analysis FAQs
What is qualitative data?
Qualitative data is non-numerical information that describes experiences, opinions, and context. It’s especially valuable for impact organizations because:
- It captures the how and why. While numbers show what happened, qualitative data explains how and why it happened, often in stakeholders' own words. For example, an employment rate tells you how many participants found jobs, but a testimonial reveals what helped them get hired and stay.
- It comes in many forms. Common types for impact organizations include interviews, focus groups, open-ended survey responses, field notes, and documents.
- It can be structured for analysis. Once you use a standard set of codes to sort the data, qualitative data can be sorted, compared, and even counted alongside your quantitative metrics.
What is qualitative data analysis?
Qualitative data analysis is the process of systematically examining non-numerical data to identify patterns, themes, and meaning. In an impact reporting context, the process has three defining characteristics:
- A clear path for translating raw text into findings. With a structured qualitative data process, analysts can organize the data, apply codes, group codes into themes, and test those themes against the evidence.
- Reportable findings as the end product. Instead of a collection of disconnected ideas, qualitative data analysis ensures that the output is a set of organized themes and evidence statements that explain what changed and why for your investors.
- Systematic, but grounded in interpretation. A defined process lets others trace how you reached each conclusion. However, a human ultimately decides what the patterns actually mean and how to present them in your reports.
What is coding in qualitative data analysis?
Coding is the process of labeling passages of text with short tags, called codes, that describe what each passage is about. For example, a participant's comment about knowing their hours two weeks in advance might get the code “Schedule Predictability.” Once your data is coded, you can sort, compare, and count related passages across hundreds of sources.
Related codes are usually grouped into broader categories so similar ideas stay together. Teams record each code's definition and rules in a codebook, which keeps everyone applying codes the same way. You can start with a set list of codes, let new ones emerge as you read, or combine both approaches.
How is qualitative data analysis different from quantitative data analysis?
Qualitative and quantitative analysis answer different questions, but they're strongest when used together. Let’s say you’re measuring the effectiveness of a workforce development program, and you find these perspectives:
- Quantitative: 68% of participants were employed six months after completing the program.
- Qualitative: Interviews show that participants valued predictable schedules more than wage increases, and that those without them were more likely to leave their jobs.
Each view misses something on its own. The percentage shows scale but not why some placements stuck. The interviews explain retention but not how widespread the pattern is.
When should impact organizations analyze qualitative data?
Qualitative analysis is most useful when your numbers raise a question they can't answer alone. Impact organizations typically turn to it for:
- Explaining why outcomes are above or below target. Interviews can show whether a missed goal came down to outreach, eligibility rules, or timing.
- Capturing stakeholder voice in impact reporting. Boards, funders, and investors want to hear from participants, grantees, and portfolio company customers. Analyzed quotes carry more weight than a lone anecdote because they reflect a documented pattern.
- Surfacing unintended outcomes or impact risks. Open-ended responses reveal side effects your surveys didn't think to ask about.
How much qualitative data do you need?
There's no fixed number. As the CDC puts it, "there are no rules on how many observations it takes to attain valid results." Instead, aim for saturation, or the point at which new data stops producing new insights. When your last few interviews only repeat themes you've already coded, you likely have enough.
Since you can't know in advance when you'll reach saturation, plan a range rather than a set number and check your progress as you go. Which people you talk to matters as much as how many. Choose sources intentionally, picking information-rich voices on purpose, like participants who finished a program and those who left early.
Qualitative Data Analysis Methods
Impact organizations use several common qualitative data analysis methods to draw insights from their dataset. Each suits a different goal, from spotting patterns across many interviews to explaining how change unfolded within a single program. They are:
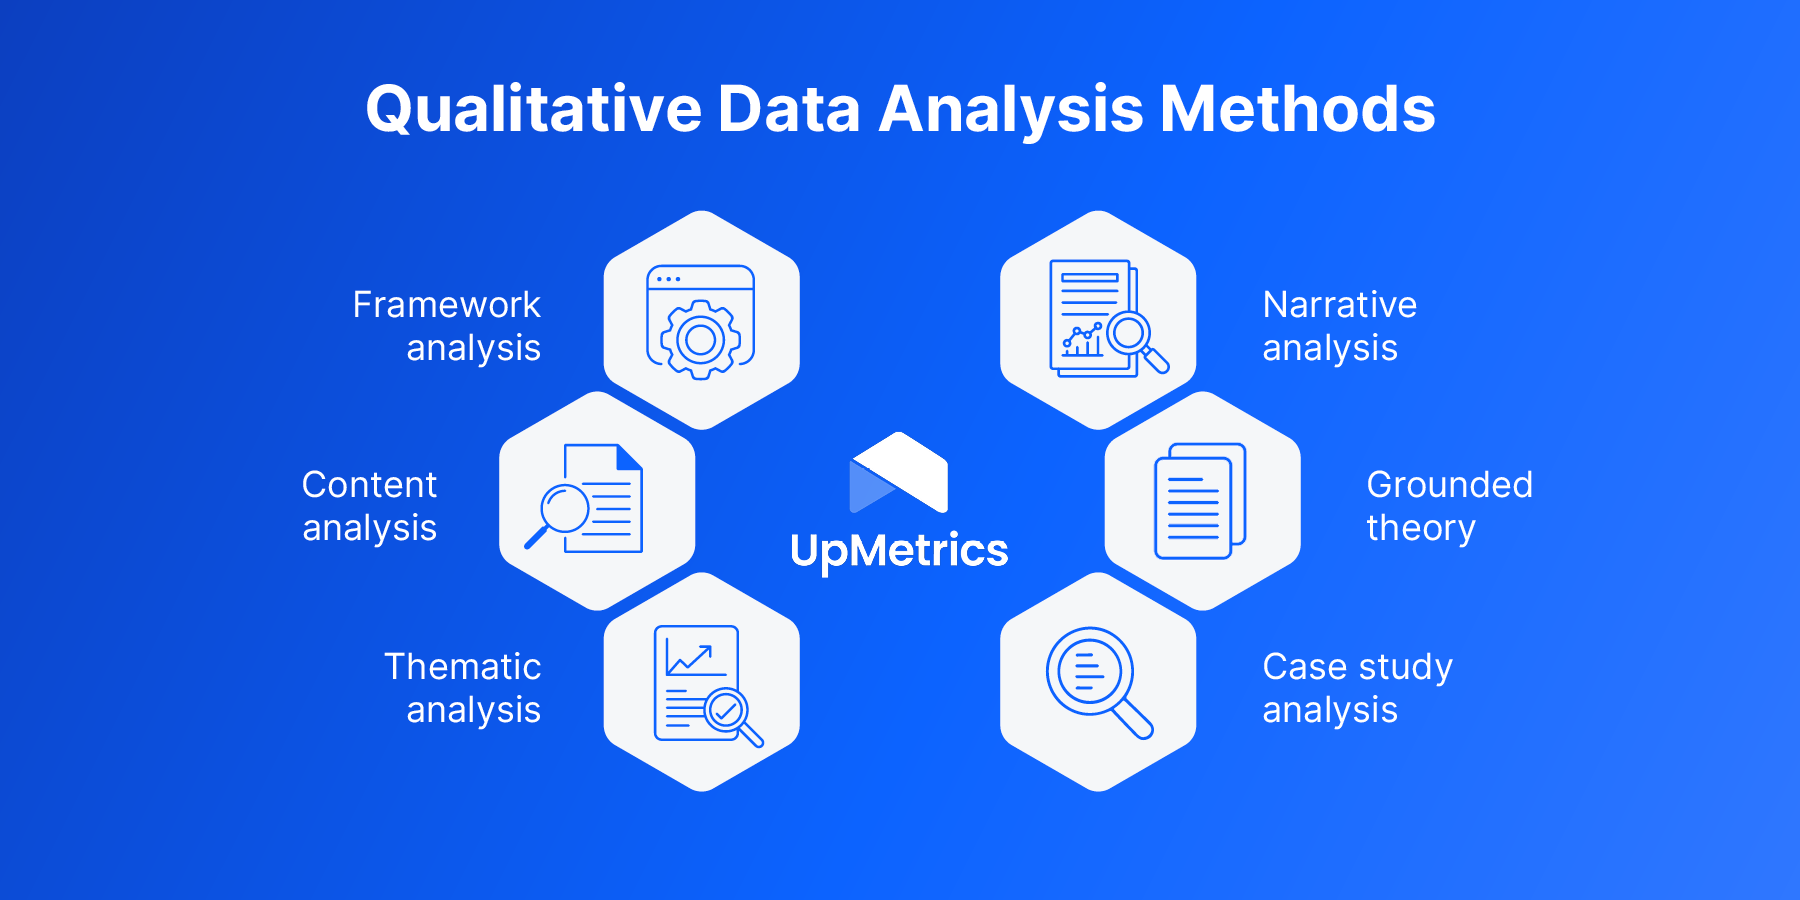
- Framework analysis: Compare every case against the same impact framework, such as a theory of change or Impact Frontiers' five dimensions of impact.
- Content analysis: If you need to quantify what shows up in large volumes of text, like narrative grant reports, this method sorts each passage into categories so you can count how often ideas appear.
- Thematic analysis: Analysts look for recurring patterns across interviews or open-ended responses. Because it can adapt to almost any dataset, thematic analysis makes a strong default for most impact teams.
- Narrative analysis: This method traces how stakeholders describe change over time. Pay close attention to turning points, sequence, and word choice.
- Grounded theory: Instead of starting with a predefined list of codes, this method allows you to build your codes and explanations from what participants actually say. It’s useful when you're studying something new, like a pilot program, and no existing framework can explain what's happening.
- Case study analysis: With this method, you use case studies to focus on one program, partner, or small dataset, combining interviews, documentation, and observations into a full picture.
Here’s a practical breakdown of each method to help you choose yours:
|
Method |
Best for |
Example impact question |
|
Thematic analysis |
Finding patterns across many sources |
What barriers do participants face across our programs? |
|
Content analysis |
Categorizing large volumes of text |
How often do grantee reports mention staffing challenges? |
|
Framework analysis |
Comparing cases against set criteria |
How does each investment perform against our theory of change? |
|
Narrative analysis |
Understanding change over time |
How do participants describe their path to stable work? |
|
Grounded theory |
Building new explanations |
Why is our new pilot working differently than expected? |
|
Case study analysis |
Understanding one program in depth |
What made the subject of this case study effective? |
How to Analyze Qualitative Data
To see how qualitative data analysis works in practice, let’s focus on a hypothetical situation involving a workforce development funder with 40 participant interviews from its five partner programs. Its dashboard shows that 68% of participants are still employed six months after finishing a program. The team wants to understand why some placements last and others don't. Get started with these steps:
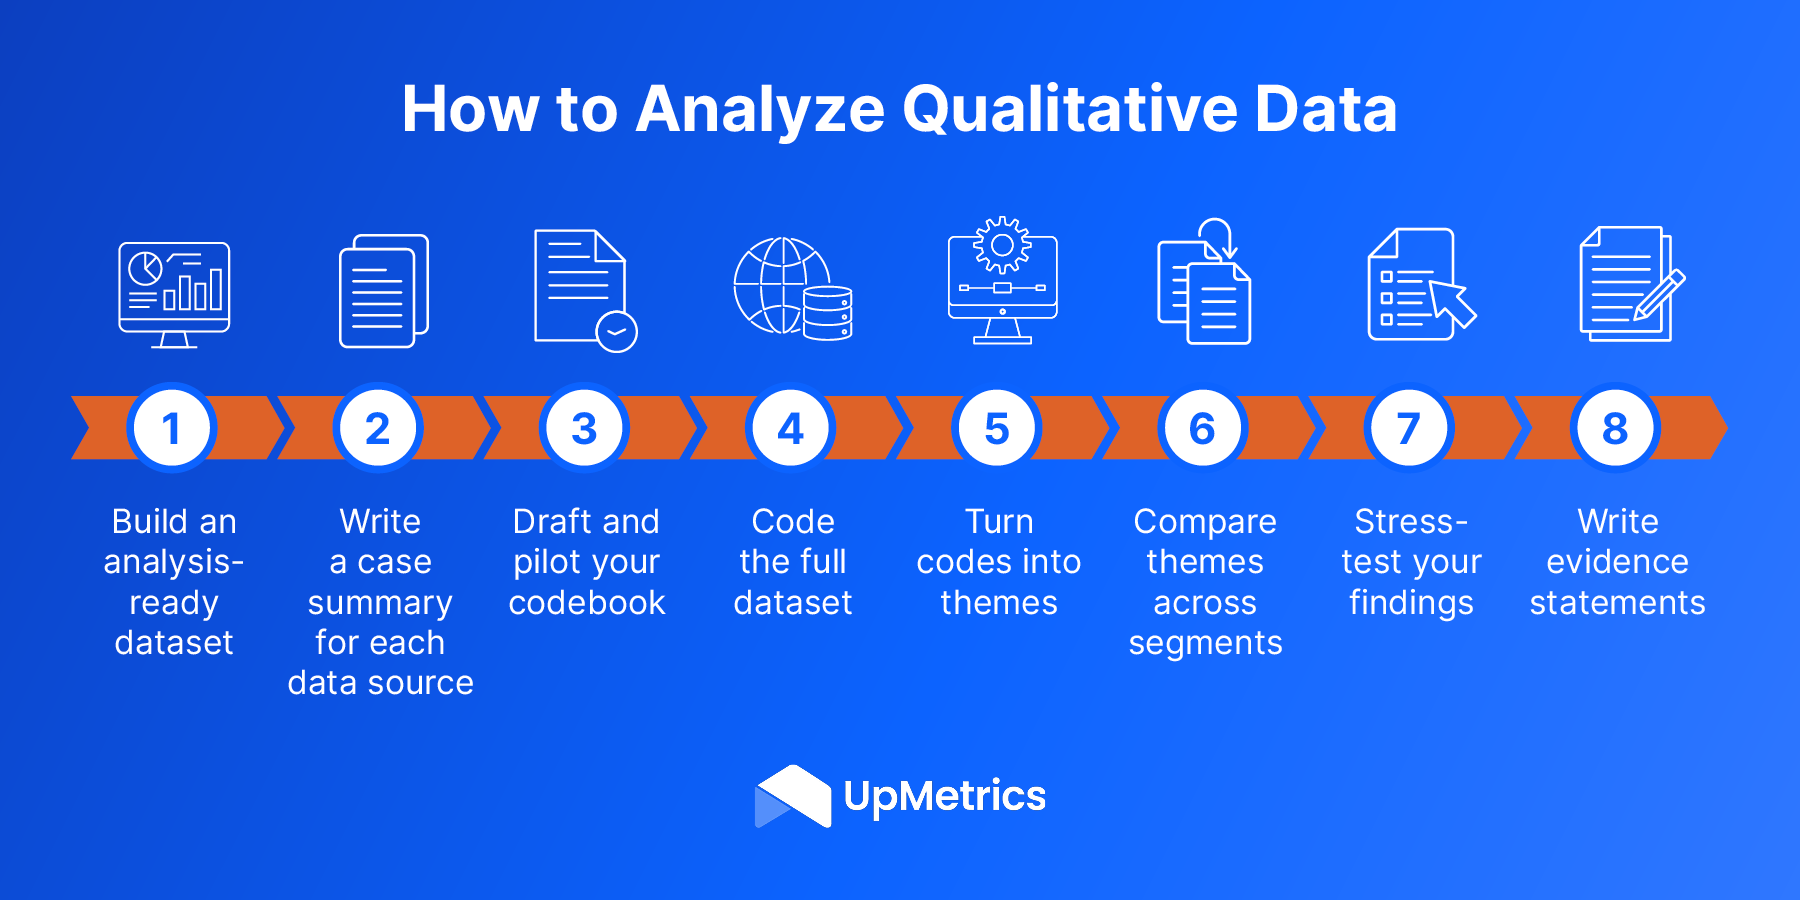
Step 1: Build an analysis-ready dataset
Good analysis starts with organized data. Give each interview, report, or survey response its own record, and tag it with the program, event date, content type, and stakeholder type. Journey stage (intake, check-in, or exit) and evidence source (self-reported or verified) are worth tagging, too, since they let you slice findings later.
Then, choose your unit of analysis (e.g., individual excerpts, full responses, or whole cases). Excerpts give you precise counts while whole cases preserve context, so pick the one that fits your questions and apply it consistently.
In practice: The funder creates 40 records, each tagged with program, interview date, journey stage, and whether the participant completed the program or left early. The funder’s team chooses individual excerpts as its unit of analysis, so it can later count how often each idea comes up across all 40 interviews.
Step 2: Write a case summary for each data source
Before you start coding, get familiar with the data. Begin with one source from each program or stakeholder group, since the first files in a folder often come from the same place.
Capture each source in a short summary with its main points, standout quotes, and anything unexpected. Keep a running list of those surprises, because they often become your most valuable findings.
In practice: The team starts with testimonials from one person who’s completed the course and one who left early from each program. While summarizing those interviews, staff notice that several early leavers blame last-minute schedule changes for losing their jobs. They hadn’t encountered this outcome before, so they note it as a lead to explore.
Step 3: Draft and pilot your codebook
A codebook is your team's shared rulebook for analysis and data categorization. Codes are the labels you apply to stories, and categories group related codes together (e.g., Category: Geography; Code: North America). Impact organizations should choose categories that match how they report and support the program’s objectives.
Before you code everything, set up a few guardrails:
- Clear definitions: For each code, write a one-sentence definition and include a real quote that shows it in use.
- A pilot round. Have two team members code the same small sample (about 10% of your data) without comparing notes. Then, look at where they tagged passages differently and tighten definitions that caused confusion.
- A single owner. Assign one person to approve codebook changes so definitions stay consistent across teams and reporting cycles.
In practice: The example funder's codebook follows the core principles of coding qualitative data. Here's what it includes:
|
Category |
Code |
Code Definition |
Example quote |
|
Job quality |
Schedule predictability |
How consistent a participant's work hours are |
"I finally know my hours two weeks out, so I can plan childcare." |
|
Program experience |
Staff relationship |
How participants describe program staff |
"My coach still texts me to check in." |
|
Outcome area |
Stayed employed |
Participant held a placement for six months or more |
"I'm coming up on a year at the warehouse." |
Step 4: Code the full dataset
Once you’ve tested and standardized your codebook, apply it to every source. You might encounter datasets that require new codes, so you should review your data regularly to bridge any gaps.
Also, keep a changelog that documents every codebook change with a date. A dated log keeps later coding consistent with earlier coding and shows exactly which material needs recoding after a definition changes.
In practice: Several participants credit a mentor at their new job with helping them stay, but no existing code fits those quotes, so the team tags them as “emerging.” Once the same theme comes up five times across different participants, the codebook owner adds a new “workplace mentorship” code and logs the change.
Step 5: Turn codes into themes
Codes describe your data, while themes explain it. In other words, a theme is a main finding that shows up multiple times across your data; codes help you sort data to identify these themes easily.
To find your themes, start by counting which codes appear most often. Then look for codes that keep showing up on the same quotes, since that usually means one thing is affecting another. Those overlaps are where your strongest themes usually come from.
Write each theme as a full sentence that states what you found. A single word or topic doesn't work as a theme, because it doesn't tell readers what you learned.
In practice: The funder's most common codes are “schedule predictability” and “stayed employed,” and they often appear on the same quotes as “childcare arrangements.” Instead of writing down an idea like schedules, the team writes a full theme: Participants with predictable schedules stay employed longer because they can arrange reliable childcare.
Step 6: Compare themes across segments
A theme that’s present throughout your dataset has a different meaning from one that shows up in a single program. Use the metadata from the first step to compare themes across programs, stakeholder groups, sentiment, and time periods.
As you do this, pay attention to where a theme is weak or missing, but compare source counts to program size before shaping your analysis around this gap. The gap itself isn’t always useful; it’s what’s causing the gap that you need to pay attention to. For instance, a large program with only a handful of interviews has an evidence gap to fill, while a well-documented program whose participants never mention schedules has a real finding.
In practice: Comparing segments shows the schedule theme is strongest among parents in shift-based industries. One small program contributed only three interviews, so the team flags it as an evidence gap rather than an actual finding.
Step 7: Stress-test your findings
You need to ensure that your findings are credible before building your analysis and reports around them. Before compiling your findings, run them through these checks:
- Contradicting cases. Look for quotes that disagree with your theme. These exceptions show you where the theme stops being true, so you don't overstate it in a report.
- Alternative explanations. Before you settle on why a pattern exists, ask what else could cause it. Participants with steady schedules might also earn more, for example, and higher pay could be what keeps them employed. Also, check where the quotes came from, since staff summaries and self-reported surveys tend to paint a rosier picture than direct interviews.
- A second reviewer. Ask a colleague to review a sample of your tagged quotes. People may gradually start applying codes differently without noticing, and a second set of eyes catches those slips before they skew your findings.
- Stakeholder input. Share your findings with program staff or participants. They know the day-to-day reality, so they can tell you whether a theme matches their experience or whether you've misread something.
In practice: One participant had a fixed schedule and still left within three months because of a 90-minute commute. Rather than discarding the case, the team narrows its claim: Predictable schedules support retention when transportation is stable.
Step 8: Write evidence statements
An evidence statement packages a finding so readers can trust it and use it. Pair each finding with its scope, a representative quote, and what it means for your outcomes. Also, keep it simple by ensuring each one is short enough to fit in a report paragraph or dashboard annotation.
In practice: Here's the funder's finding written two ways:
- What people said: 28 of 40 participants mentioned their schedules.
- Full evidence statement based on evidence: Predictable schedules were the factor participants most often linked to staying employed (28 of 40 interviews), especially parents. As one participant said, "I finally know my hours two weeks out, so I can plan childcare." Employer partners with stable scheduling may support stronger six-month retention.
Save your codebook, change log, and evidence statement format as templates once you're done. That way, your next reporting cycle will start with a strong, tested foundation.
Best Practices for Qualitative Data Analysis
Strong qualitative analysis is consistent, transparent, and connected to the rest of your impact data. Following these practices will help your findings hold up with boards, funders, and investors and stay comparable from one reporting cycle to the next:
- Collect stories year-round. Gathering quotes only when a report is due leaves you with a rushed, thin sample. Build short check-ins, surveys, or interviews into your program calendar so you can gather evidence consistently and see changes over time.
- Protect participants' privacy. Ask permission before you share anyone's words outside your team, and remove names or details that could identify them. People speak more openly when they trust that their stories will be handled with care.
- Flag report-ready quotes as you go. When you find a quote that's strong, representative, and approved for sharing, tag it so you can find it later. That way, your best evidence is ready when a grant report or board update is due, instead of buried in transcripts.
- Track sentiment alongside codes. Tag evidence as positive, neutral, or negative to see how perceptions shift over time. Then, use sentiment to complement interpretation. These aspects work together; a negative tag shows frustration, and your analysis explains why.
- Choose representative quotes over memorable ones. For high-stakes audiences like grant panels or limited partners, favor quotes backed by documentation.
- Pair code counts with interpretation. Counts show scope and reveal what's underrepresented, while interpretation shows what it means.
- Use AI as a first-pass assistant alongside human reviewers. In a May 2026 report on a survey of 332 research practitioners, Condens found 91% use AI in some form. Using purpose-built AI tools can help with transcription, summaries, and first-pass coding. However, human review still matters; only 21% of respondents from that same survey trust AI outputs with minimal review, citing problems like generic insights (52%) and lost context (42%).
- Store narrative and numbers in one system of record. Keeping stories in shared drives and metrics in a dashboard is like keeping a box of receipts and re-adding them every time a funder asks what you spent. Purpose-built impact reporting software removes those error-prone workarounds. For instance, UpMetrics Stories keeps qualitative evidence alongside your Key Impact Indicators (KIIs). With Stories, you can:
- Capture quotes, transcripts, case studies, and other types of qualitative data points with a title, main text, and internal notes
- Record when impact happened with an Event Date, separate from the entry date
- Attach images, audio, video, documents, and links
- Classify entries by content type, like testimonial or survey response
- Apply codes organized under categories
- Link stories to one or more programs
- Govern the codebook with admin and editor roles
- Tag sentiment as positive, neutral, or negative
- Bulk import stories from validated CSV templates
- Bulk edit dates, sentiment, programs, and codes
- Analyze coded stories in Advanced Analytics without spreadsheets, scripts, or SQL
- Build live dashboards of sentiment trends, code frequencies, and coverage gaps
- Search, filter, and sort by code, sentiment, program, date, or creator
- Export the full dataset to CSV
Your participants' stories already hold the answers to your hardest impact questions. The right method tells you where to look, a clear process turns scattered quotes into findings, and good habits keep those findings credible year after year. Put it all together, and every interview becomes proof of the difference your work makes.
For more on turning data into impact evidence, explore these resources:
- Impact Reports: What They Are + How to Make Yours Exemplary: Learn what makes an impact report stand out, so your hard-won findings land with funders and boards.
- Annual Impact Report Planning: How to Use This Year's Data for Next Year's Decisions: Find out how to turn this year's data into smarter decisions for next year's programs.
- Theory of Change Software: A Guide for Impact Investors: Explore how impact investors map the path from investment to outcome, and the tools that make it easier.