Fund-Level Impact Aggregation: A Guide for Fund Managers
Impact Capital Managers’ Impact Allocator Perspectives 2025 research found that 68% of the 34 allocator institutions (LPs) it surveyed, representing more than $885 billion in assets, find it hard to compare impact across the fund reports they receive. Fund managers will recognize why: a single fund may back companies across several impact themes, each tracking results in its own units and on its own timeline. This makes it difficult to understand the fund’s overall impact.
Fund-level impact aggregation helps fund managers make that comparison more manageable, combining data from portfolio companies (also called investees) into a unified view of what the fund’s capital is achieving. Done well, it gives LPs a clearer picture of results and gives fund managers and portfolio companies a shared basis for learning and improvement.
In this guide, we cover key terms, common questions, a step-by-step process, and best practices for fund-level impact aggregation (with notes on EU and UK rules for funds marketed to investors there).
Table of contents
- Fund-Level Impact Aggregation Glossary
- Fund-Level Impact Aggregation FAQs
- How to Aggregate Fund-Level Impact Data
- Best Practices for Fund-Level Impact Aggregation
Fund-Level Impact Aggregation Glossary
Impact measurement and reporting have their own vocabulary. These terms can be used inconsistently across the industry, so here's how we use them in this guide:
- Aggregation method: The rule a fund uses to combine investee results for a given metric into one fund-level figure. Methods include summation, weighted averages, and progress toward targets (more on this later).
- Attribution: The process of crediting a fund with a share of an investee’s results, usually in proportion to its ownership or share of financing, rather than claiming 100% of them. It’s distinct from contribution, which looks at what the investor did to help the outcome happen.
- Core and custom metrics: Core metrics are the small set that every portfolio company reports so the fund can aggregate them. Custom metrics are specific to each portfolio company and are reported alongside fund-level figures rather than added into them.
- Data coverage: The share of the portfolio, by number of portfolio companies or dollars invested, that a reported figure actually includes.
- Fund-level and portfolio-level: These are three nested levels of impact data. “Investee-level” means a single portfolio company. “Fund-level” means one fund and all the companies it invests in. “Portfolio-level” depends on who’s reporting: for a fund manager, it’s every fund it manages; for an LP, it’s every fund (and any direct investment) it has put money into, often across several fund managers. Many investors use “portfolio” to mean a single fund’s holdings, so it’s worth clarifying which one a report means.
Fund-Level Impact Aggregation FAQs
What is fund-level impact aggregation?
Fund-level impact aggregation is the process of combining impact data from a fund’s portfolio companies into one view of the fund’s social outcomes. It doesn’t make all the results add up, since disparate metrics can’t be meaningfully summed at face value. Instead, it relies on a small set of shared core metrics, a clear method for combining each one, and transparent reporting of what can’t be combined.
Why is fund-level impact aggregation important?
LPs and boards expect a fund-wide view of results, and in some jurisdictions (notably the EU and UK), regulators require fund-level sustainability disclosures for funds marketed as sustainable. Aggregated impact data supports:
- LP and board reporting: A clear, comparable account of what the fund’s capital accomplished.
- Fundraising: A documented impact track record for the next fund.
- Portfolio decisions: Visibility into which themes and investments deliver results and which need support.
- Regulatory disclosure: Meeting fund-level sustainability disclosure rules for funds marketed as sustainable in the EU or UK.
- Credibility: When done transparently, aggregation helps guard against impact-washing (exaggerated or unsupported impact claims). Done carelessly, such as by claiming 100% of results that other investors also funded, it can contribute to it.
What are the biggest challenges of fund-level impact aggregation?
The core challenge is that impact, unlike revenue, has no universal unit of measurement. Comparing results across portfolio companies can feel like comparing apples to oranges, and many practitioners argue that results using different units shouldn’t be added together at all.
Fund managers often encounter these obstacles when aggregating fund-level data:
- Generic metrics: Forcing every company into the same set of metrics makes results easier to combine, but it can strip out what each company actually achieves individually.
- Accounting for context: Even when impact metrics are directly comparable, fund managers need to consider each portfolio company’s circumstances. For instance, a first loan to a borrower with no credit history, in a community with few banks, likely changes more for that person than a loan to someone who already had other affordable options. Both count as one ‘client served,’ but the depth of change is very different.
- Double counting: Five investors who each put $2 million into a $10 million round wouldn’t each tell their LPs they funded a $10 million company. Yet that’s effectively what happens when co-investors each report 100% of a company’s impact: the impact claimed across the market adds up to far more than what actually occurred.
- Data quality and capacity: Portfolio companies measure with different levels of rigor, and building an aggregation process takes time and budget, especially for smaller managers.
How is fund-level impact aggregation different from investee-level or portfolio-level measurement?
These terms aren’t used consistently across the industry, and many investors say “portfolio” when they mean a single fund’s holdings. In this guide, we use them as follows:
|
Level |
Unit of analysis |
Who creates it |
Who reads it |
Example in practice |
|
Investee-level |
A single portfolio company or project |
The portfolio company |
Company leadership and the fund’s impact team |
A solar developer reports that it avoided 8,000 metric tons of CO2 emissions last year. |
|
Fund-level |
One fund and all of its investments |
The fund manager and its impact team |
The fund’s LPs, board, and investment committee |
A $150M climate fund reports its share of the emissions avoided by its 14 portfolio companies, based on its ownership stake in each. If it owns 20% of the solar developer, it counts 1,600 of that company’s 8,000 tons. |
|
Portfolio-level |
Every fund a fund manager manages, or every fund an LP invests in |
A fund manager with multiple funds or an LP such as a pension fund or fund of funds |
Firm leadership, boards, and the firm’s own investors |
A fund manager adds up its attributed share of emissions avoided across all three of its climate funds, including the $150M fund above. |
What impact frameworks help investors aggregate and track impact at the fund level?
Impact frameworks give fund managers and portfolio companies a shared language for defining, measuring, and reporting results, which makes their data easier to compare. That shared language shouldn’t become a one-size-fits-all template. The most widely used tools do different jobs:
- Metric catalogs: IRIS+, managed by the Global Impact Investing Network (GIIN), provides standardized definitions of impact metrics. Because it defines exactly what to count, it’s the most direct driver of comparability across portfolio companies.
- Classification lenses: The five dimensions of impact from Impact Frontiers classify impact by what outcome occurs, who experiences it, how much change occurs, the investment’s contribution, and the risk that impact differs from expectations.
- Goal frameworks: The UN Sustainable Development Goals (SDGs) are 17 global goals, not metrics. Funds use them to map and communicate impact themes.
Funds subject to SFDR may also report their principal adverse impact (PAI) indicators, which measure an investment’s negative effects, such as emissions, rather than its positive impact.
Each fund should choose the frameworks that fit its strategy and portfolio companies. Mapping core metrics to those frameworks in a centralized impact reporting platform also lets investors track progress toward fund-level goals over time, rather than rebuilding comparisons every reporting cycle.
Is fund-level impact aggregation required?
In the US, there’s no federal requirement to aggregate or disclose fund-level impact results, and the SEC withdrew its proposed ESG fund disclosure rule in June 2025. LP expectations drive aggregation during due diligence and ongoing monitoring. In a 2026 report drawing on more than 40 institutional investors and advisors, ILPA identified data limitations as one of the most significant barriers to institutional investment in impact funds and noted the heavier due diligence burden this places on LPs.
Funds that raise or invest capital in Europe face more specific rules. Under the EU’s Sustainable Finance Disclosure Regulation (SFDR), Article 8 and 9 funds must assess in their periodic reports whether their sustainability characteristics or objectives were met. Under the UK’s Sustainability Disclosure Requirements (SDR), funds using a sustainability label must set KPIs and report progress against their sustainability objective, at either the fund or asset level.
SFDR is also being overhauled: the European Commission’s “SFDR 2.0” proposal would replace the Article 8 and 9 categories with three product categories (Sustainable, Transition, and ESG Basics). It’s still being negotiated between EU institutions and isn’t expected to apply until 2028 or 2029.
How to Aggregate Fund-Level Impact Data
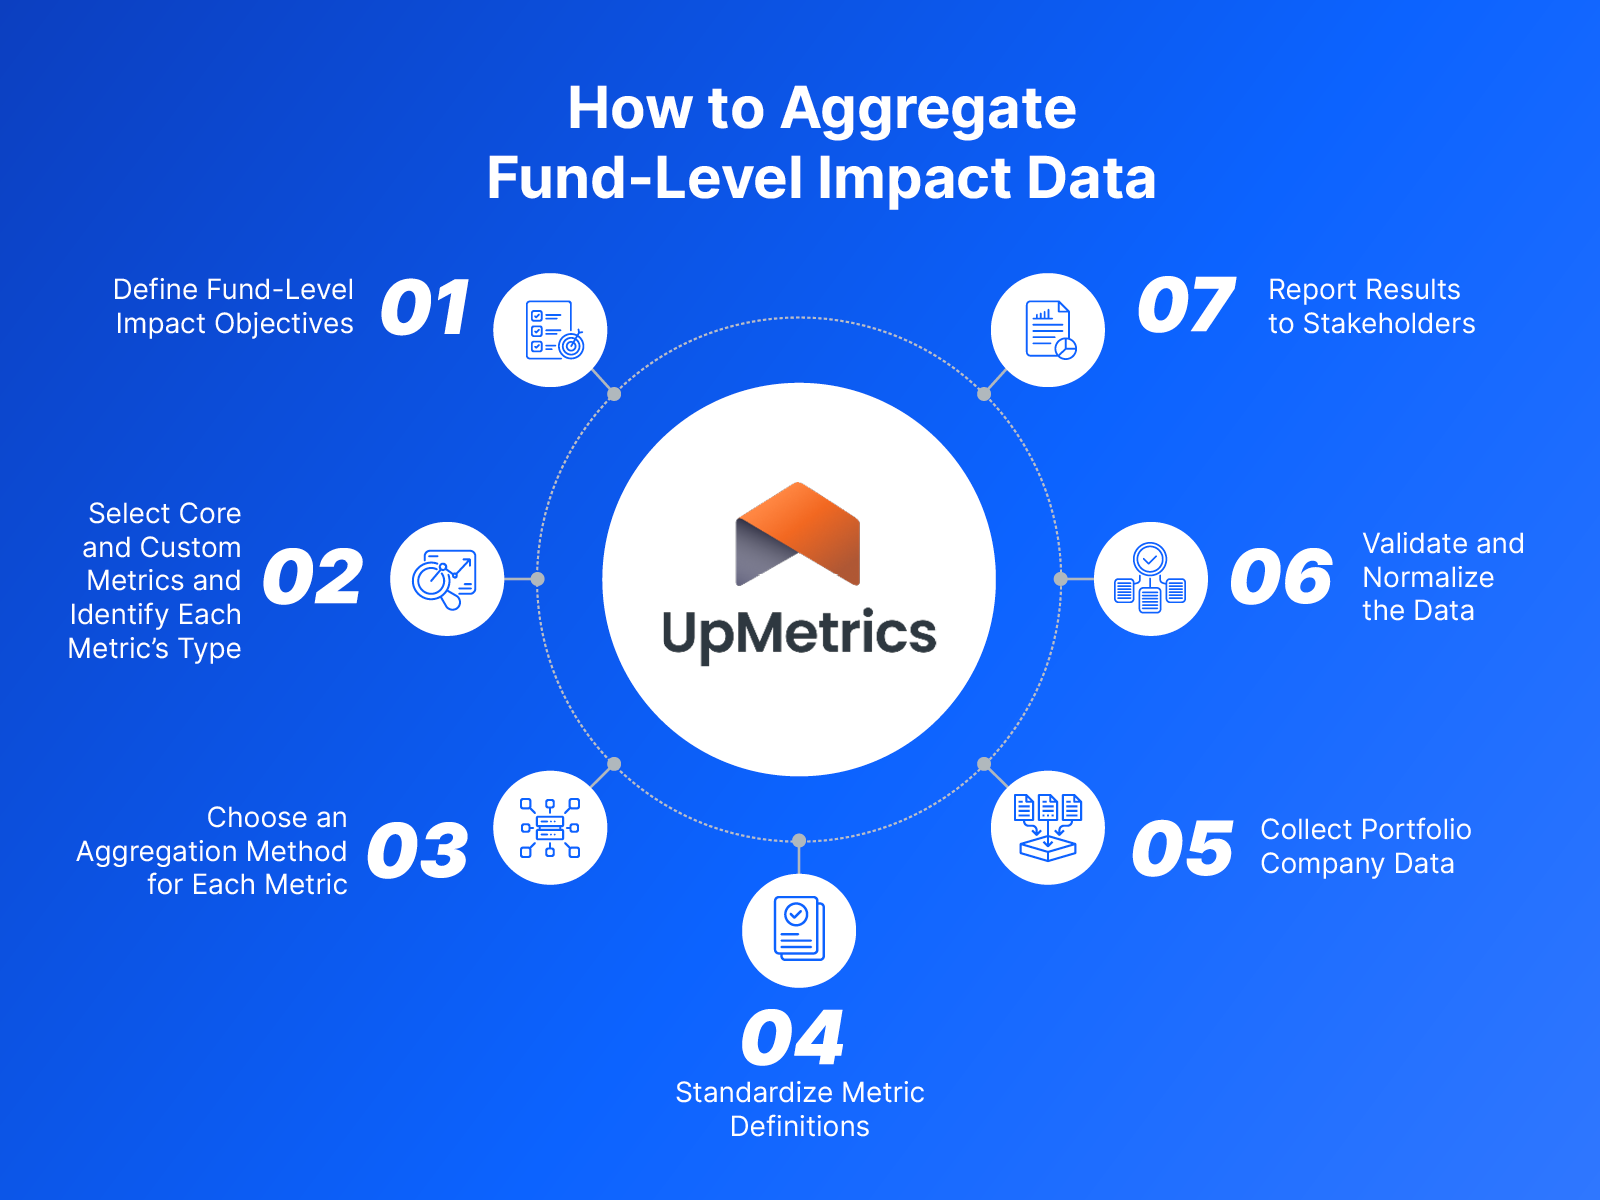
The steps below cover the full cycle, from setting fund-level objectives to reporting results. To show how each step builds on the last, we’ll follow one example fund through the whole process: a $100 million fund focused on expanding access to affordable financial services, invested in 12 companies, including community lenders, fintech lenders, and a savings app.
Step 1: Define Fund-Level Impact Objectives
Start with the fund’s impact thesis and theory of change (its map of how investments are expected to lead from activities and outputs to outcomes and long-term impact). Use them to set the outcomes the fund will report on, then translate each outcome into one or two questions the fund-level data must answer, such as “How many low-income clients gained access to affordable credit this year?”
For each objective, identify the audience (LPs, the board or investment committee, and regulators if the fund is marketed as sustainable in the EU or UK) and the decisions the data will inform, such as follow-on investment or portfolio focus. LPs typically want progress against the fund’s stated targets. Most funds land on three to five to adequately report on all relevant data without getting overwhelmed.
Example fund’s approach: The fund sets three objectives: expand access to affordable credit, improve borrowers’ financial health, and build household savings. Its LPs want to see progress against a target of reaching 50,000 low-income clients.
Step 2: Select Core and Custom Metrics and Identify Each Metric's Type
Think of metric selection in two layers. Core metrics, typically fewer than ten, are shared across the fund. Every portfolio company reports them, and those figures are aggregated. Custom metrics are specific to each portfolio company, defined in collaboration with it, and reported alongside fund-level figures rather than being forced into the totals. Impact metrics work much like financial reporting. For instance, every portfolio company reports revenue and EBITDA in the same format so the fund can roll them up, but each board still tracks the KPIs that matter for that particular business, like net revenue retention at a software company.
When choosing core metrics, favor ones that portfolio companies already track in their own systems, since those numbers tend to be more reliable, and align each one with a standard such as IRIS+ where possible. Include outcome metrics alongside output metrics, so the fund can show what actually changed, not just what was delivered.
As you choose each core metric, note whether it’s a count, a percentage, or a rate. The type determines which aggregation methods will work and what portfolio companies must report. Percentages and rates need weighted averages, not simple averages, so the fund must also collect the counts behind them, such as low-income borrowers and total borrowers. Funds that skip this often discover the gap at reporting time, when it’s too late to ask.
Example fund’s approach: The fund chooses seven core metrics and labels each one. Low-income clients served is a count, reported by every lender using IRIS+’s standard definition so the figures can be added together. The share of each lender’s borrowers who are low-income is a percentage, and so is the fund’s main outcome metric: the share of borrowers whose credit scores improved after 12 months. Each portfolio company also tracks custom metrics, such as the savings app’s average emergency savings balance, which the fund reports alongside its totals.
Step 3: Choose an Aggregation Method for Each Metric
An aggregation method is the rule a fund uses to combine each investee’s results for a given metric into a single fund-level figure. Selecting the right method depends on what the metric measures and how much of each investee’s results the fund can credibly claim. You’ll need to choose methods before collecting any data, because each method requires specific inputs.
Here are some common options:
- Simple summation adds every investee’s result to a single total. It works when each portfolio company counts different people or things, so nothing gets counted twice. The trade-off is that it reports 100% of each investee’s results, even when other investors also funded that company.
- Ownership or investment-share attribution multiplies each investee’s result by the fund’s ownership share, then sums the results. It reports only the fund’s proportional share, which avoids double counting, though it requires each investee’s current ownership or financing share.
- Weighted averages convert each investee’s percentage or rate back into the counts behind it, add those counts, and divide by the combined total. Never take a simple average of investee percentages. Weighting by the counts behind them means a lender with 40,000 borrowers moves the fund-level figure more than one with 10,000.
- Progress toward targets compares each investee’s results with the target set at investment, then summarizes how investees are performing against their own goals. Because it measures progress rather than raw numbers, it works across sectors and units. The MacArthur Foundation, for example, sets measurable impact targets with each investee at the outset, which lets it assess performance across its entire impact portfolio without adding up unlike metrics.
- Thematic harmonization groups different but related investee metrics under a shared impact theme without reducing them to a single figure. This method fits portfolio companies that measure similar outcomes in different ways. For example, a savings app tracking emergency savings accounts opened and a lender tracking borrowers who complete financial coaching can both report under a ‘financial health’ theme, each with its own metric.
- Categorical rollups count how many investees meet a goal. They handle results that can’t be added together, including qualitative ones, showing how many investees made progress rather than by how much.
- Common-unit conversion turns different outcomes into one shared unit, usually dollars, so they can be added together. That makes it possible to report a single figure across very different investments, but because the dollar values rely on estimates, the original metrics should always appear alongside it.
Whichever methods you choose, decide up front whether each figure reports 100% of investee results or the fund’s proportional share. Many funds report both with clear labels so that LPs can see both the scale of what investees achieved and what the fund can credibly claim.
To choose your methods, match each metric to its type. Use summation or attribution for counts, weighted averages for percentages and rates, and progress toward targets or categorical rollups for results that don’t share a unit.
Example fund’s approach: The fund will sum low-income clients served, attribute loan volume by its ownership or financing share in each lender, use weighted averages for its two percentages, and track each portfolio company’s progress toward its company-specific targets. To align with these choices, the fund adds ownership or financing shares, total borrower counts, and each portfolio company’s targets to its data request.
Step 4: Standardize Metric Definitions
Next, record how each metric must be measured in a data dictionary, a shared document every portfolio company works from. Without one, “low-income clients” might mean different things to different portfolio companies. For each metric, specify:
- Definition: The exact criteria for what the metric includes and excludes, written so that any two companies would count the same things.
- Metric type: Count, percentage, or rate.
- Unit: What a single count of the metric represents, fixed in advance so every company reports figures that can be added to one another.
- Reporting period: The start and end dates the figure covers, aligned across companies.
- Calculation and source: How the company arrives at the number and where the data comes from, so anyone reviewing it can trace it back and confirm it’s right.
- Aggregation method: The rule chosen in the previous step, or a note that the metric is custom and reported alongside fund-level figures rather than aggregated.
Example fund’s approach: The fund’s entry for its main credit metric reads:
- Low-income clients served: unique individuals with household income below 80% of area median income who held an active loan at any point in the calendar year, counted from the loan management system.
- Metric type: count.
- Aggregation method: simple summation.
Step 5: Collect Portfolio Company Data
Send the same structured request to every portfolio company on a regular schedule, with the data dictionary attached and a deadline that allows time for review. For every percentage and rate, ask for the numbers behind it. Pre-fill last period’s values so companies can confirm them rather than start from scratch, and ask them to explain any big changes.
To collect, categorize, and report on portfolio company data, use a purpose-built impact reporting platform, like UpMetrics. These tools allow fund managers to send each company a tailored request, track submitted data through a two-way portal, store all responses in one place, and build comprehensive reports for LPs.
Example fund’s approach: The fund sends its request to portfolio companies in January with a February 28 deadline, leaving six weeks to review before its April LP report.
Step 6: Validate and Normalize the Data
Before combining anything, check each submission for:
- Completeness: Every core metric is answered, or marked not applicable with a reason.
- Consistency: Big changes from the last reporting period are explained.
- Plausibility: The numbers make sense and can be explained to LPs.
After you’ve resolved any issues with the portfolio company, normalize the data by converting everything to the same currency, units, and time periods. Log every correction and estimate for your methodology note, which explains how each figure was calculated and where the data came from. Once you have this information, you can apply each metric’s aggregation method to produce the fund-level numbers.
Example fund’s approach: The review identifies two problems: one lender reported total loans rather than unique borrowers, and another lender’s client count tripled without explanation. The team resolves both with the lenders, logs the corrections, and runs its aggregation methods.
Step 7: Report Results to Stakeholders
Organize the report around the objectives from the first step so readers get actionable answers instead of a wall of raw data. For each core metric, show the fund-level figure, whether it reflects 100% of investee results or the fund’s share, the change from last period, progress against target, and data coverage. Report custom metrics alongside totals, tailor the format to each audience, and include the methodology note with every version.
Example fund’s approach: The fund’s annual report shows 48,500 low-income clients reached against its 50,000 target, up 15% from last year, with data from all 12 portfolio companies. The report notes that this figure reflects 100% of each lender’s clients served, while loan volume is reported as the fund’s share, based on its ownership or financing share in each lender. LPs receive the full report, and the board receives a two-page summary.
Best Practices for Fund-Level Impact Aggregation
The steps above get you to a finished report. These best practices help it hold up under scrutiny and stay useful to the portfolio companies that provided the data:
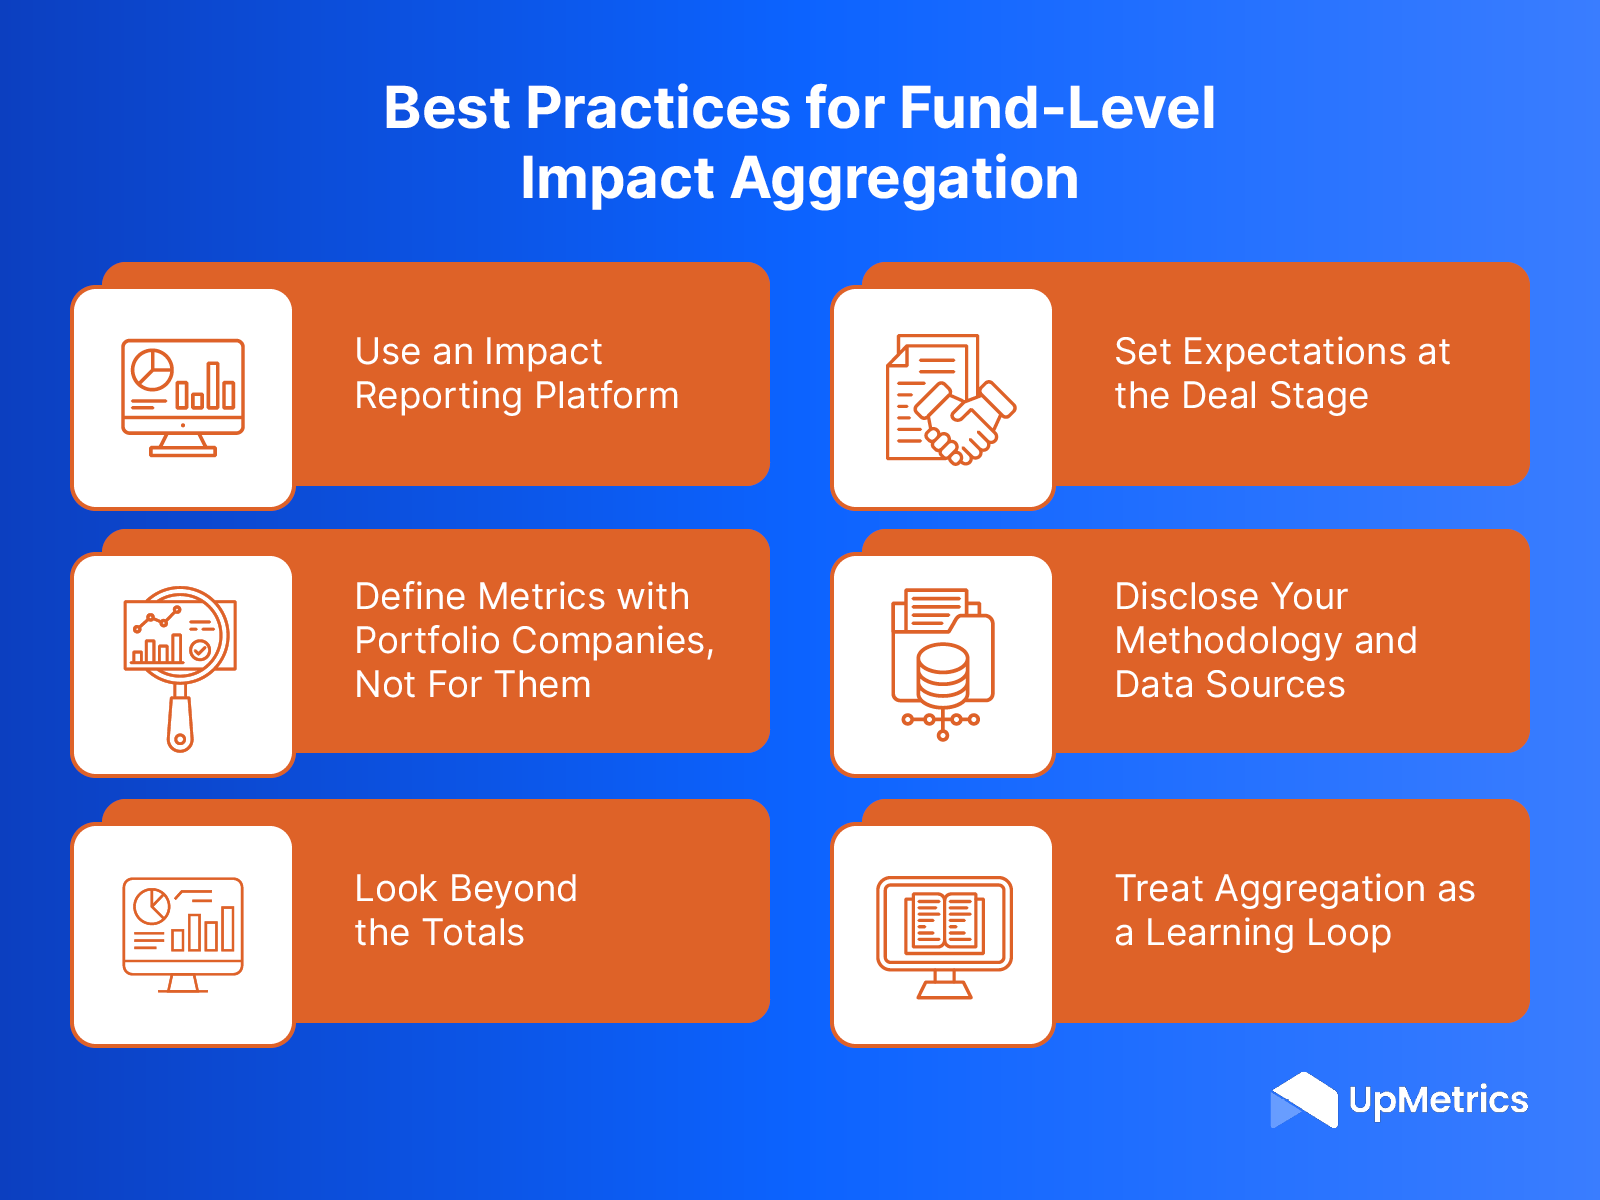
- Use an impact reporting platform. A platform like UpMetrics allows fund managers and portfolio companies to collaborate directly. Fund managers can send each company a tailored request, roll up results by theme or across the fund, and share live dashboards with LPs through secure links.
- Set expectations at the deal stage. The easiest time to agree on impact data is before the investment closes, so include core metrics and reporting expectations in term sheets or side letters, and record each portfolio company’s baseline during due diligence.
- Define metrics with portfolio companies, not for them. A shared core enables aggregation, but forcing every company into the same framework can erase each one’s distinct impact. Start by asking each company what it already measures and pair your core metrics with a few company-specific ones developed together. Also, remember to share fund-level insights back so the data helps companies, too.
- Disclose your methodology and data sources. Stakeholders can’t trust a number they can’t trace. Every report needs a methodology note covering data sources, aggregation methods, and whether figures reflect 100% of investee results or the fund’s share.
- Look beyond the totals. One standout portfolio company can carry a strong total while the rest fall behind. Show the range of results and how each company is tracking against its own targets, and then pair the numbers with stories from portfolio companies that explain why they matter.
- Treat aggregation as a learning loop. Review results with portfolio companies and revisit core metrics every year. When a metric no longer fits a company’s business, explaining the change to LPs builds more trust than forcing a number.
Fund-level impact aggregation answers the question every stakeholder eventually asks: what did this fund achieve? A credible answer depends on clear objectives, shared core metrics that leave room for what makes each company distinct, the right method for combining each metric, and honesty about what the fund can claim. The funds that do this well agree on metrics before the money moves, keep their data in one place, and treat every reporting cycle as a chance to learn.
Learn more about impact investing with these resources:
- How three investment firms are bridging the data and relationships gap to build better impact businesses. UpMetrics CEO Drew Payne and ICM’s Marieke Spence share how Capricorn Investment Group opens impact reporting conversations with its fund managers by asking what they already measure, and how SJF Ventures pairs a common set of workforce metrics with custom metrics co-created with each portfolio company.
- The Impact Investing Guide That Every Investor Needs. Use this foundational guide to impact investing strategy, measurement, and reporting for reassessing your strategy or onboarding new team members or LPs.
- Shifting Tides: Impact Investing’s Embrace of Emerging Markets and the Imperative of Impact Measurement. Impact investing is constantly evolving. Keep up with the latest trends and prepare for the future with this guide.
- How Impact Investors Can Strengthen Their Impact Story with Data. Data is the foundation of any credible impact investing operation. Learn how to best leverage your impact data in this article.