
From Scattered Data to Sustainable Systems: The Bay Area Impact Cohort Completes Its Three-Year Journey
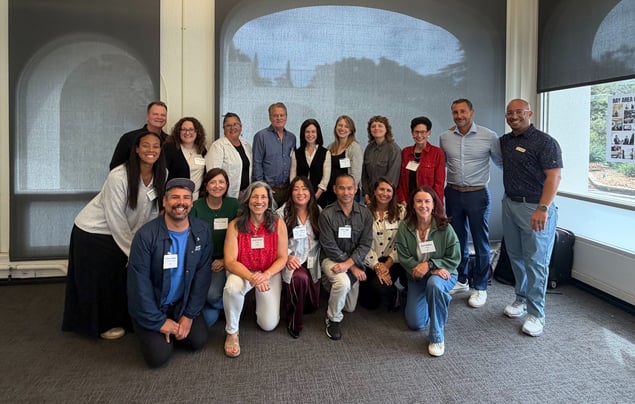
On September 15, we celebrated the completion of our first Bay Area Impact Cohort: a three-year program that brought together five nonprofits and five funders from across the San Francisco Bay Area to build impact measurement into the core of how they work.
|
Nonprofit Participants:
|
Funders:
|
The cohort started back in 2023 with two primary questions: how can funders and nonprofits learn and collaborate together towards greater impact in the Bay Area? And how do we measure what actually matters?
Answering those questions required more than good intentions. They required intentional design. "From the start, we knew that connection and trust would be as important as the frameworks and dashboards," shares Alyssa Wing, one of UpMetrics' Managing Directors and a primary facilitator of the cohort. "One of the biggest things we've heard from both our nonprofit and funder partners over the last three years is how much that sense of connection and community has mattered. They describe it as essential to building capacity and strengthening their organizational infrastructure. That didn't happen by accident. We designed every element of the three-year cohort to create the conditions for people to learn together, be honest about their challenges, and actually show up consistently."
She continues, "each nonprofit participated in monthly one-on-one sessions with our team. These weren't check-ins. They were tailored learning conversations where we could meet each organization exactly where they were, understand their specific constraints, and help them solve problems before they became bottlenecks. Quarterly virtual learning sessions brought all five nonprofits together at once, building capacity side by side. And biannual in-person convenings created space for face-to-face collaboration, shared problem-solving, and the kind of trust that only forms when people sit in a room together and work through real challenges."
That combination - individualized support plus shared learning - created a container where people felt safe enough to be honest. And that safety is what turned a cohort into a community.
Year 1: Building the Foundation
The first year was about making impact visible. That meant defining impact frameworks and key impact indicators (KIIs), which sounds simple but rarely is. Organizations had to answer hard questions before touching any software: What do we believe makes a difference? What can we actually measure? Where does this data even live right now?
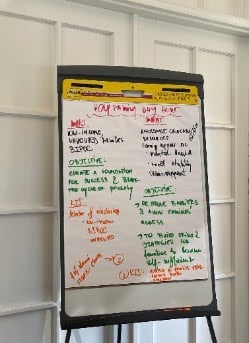
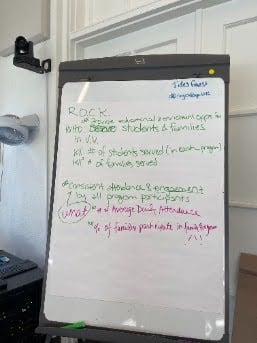
For one nonprofit participant, Real Options for City Kids (R.O.C.K), the honest answer was that data lived everywhere: spreadsheets, paper records, and institutional memory. For FACES, the challenge was different. Because their "2nd Gen" whole family model included three interconnected programs - Child Development, Family Support & Wellness, and Workforce Development - it was unclear which data mattered most, and difficult to connect the day-to-day data from multiple programs into a single narrative of impact.
By the end of Year 1, the participating nonprofits had gone from frameworks ideated on paper...
...to frameworks drafted in slide decks....
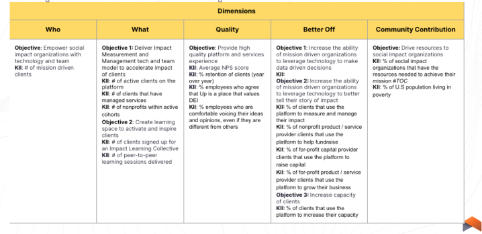
...to formalized frameworks built out in UpMetrics.
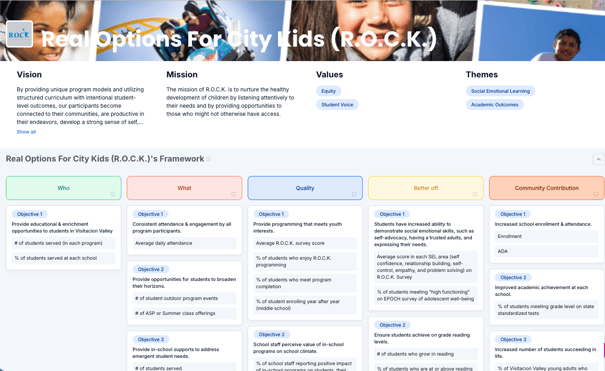
👉 View R.O.C.K's Impact Framework in UpMetrics.
Year 2: Turning Frameworks into Tools
Year 2 is where things really started to click. Frameworks became dashboards, and dashboards meant teams could see their data in real time instead of digging through spreadsheets every time a funder asked a question.
This was also the year of iteration. As a young, fast-growing organization, Women's Coaching Alliance was still figuring out what success looked like as they scaled. FACES spent Year 2 and part of Year 3 building a dashboard specifically for board members, focused on what that audience needed most. At R.O.C.K., their Deputy Director, Hanna Doerr, went from spending four hours a month calculating 14 spreadsheets to downloading four and letting the platform do the rest. Holy Family Day Home moved from disconnected departmental systems to one unified dashboard. The Arc San Francisco rebuilt its entire annual impact report in UpMetrics as a living, shareable dashboard.
👉 View The Arc San Francisco's 2025-2026 Annual Report, built in their UpMetrics dashboard.
What mattered most: these weren't generic dashboards. Every organization built something different, because every organization needed to answer different questions for different audiences. And for the first time, they could actually answer them without manual digging.
The real win wasn't just visibility. It was time. Time freed up meant teams could stop drowning in spreadsheets and start asking better questions about what the numbers actually meant.
"I've watched data go from a manual, daunting task to something that actually drives how these organizations operate," shared Ashley Reed, a Customer Success Engineer that led the technical implementation aspects of the cohort. "That shift, from reporting on impact to being led by it, is the most rewarding part of this work."
Year 3: Making Data a Habit
By Year 3, the question shifted from "can we build this?" to "how do we use it every day?" Dashboards showed up in board meetings, strategic planning sessions, and conversations with funders. Data stopped being a compliance task and started being a decision-making tool.
But what that actually looked like depended entirely on where each organization started and what they needed most.

From Bottleneck to Self-Service
Where they started: One person was the bottleneck for every number that went into a funder report. Getting data required hours of manual digging and rewriting.
What they built: Two dashboards. One for internal board planning, and one built to answer a specific funder's question about growth.
What changed: Hanna's monthly reporting time dropped significantly, and program and development teams can now pull exact metrics whenever they need them, without waiting on one person.
"The best part about this cohort was hearing about challenges other organizations are facing around metrics and data gathering, but also hearing about the solutions they've found. I felt like I learned something new to bring back to R.O.C.K. after each session."
- Hanna Doerr, Deputy Director

Building the Foundation While Growing
Where they started: As a young, fast-scaling organization, Women's Coaching Alliance needed to answer a foundational question: what should we even be measuring, and how do you show impact when your story is still unfolding?
What they built: A clarified impact framework and revised surveys that capture both measurable growth and harder-to-quantify leadership development.
What changed: WCA now has data governance built to scale with them, instead of a reckoning waiting down the road.
"My previous understanding of data integrity was basically garbage in, garbage out. Through this cohort and working with UpMetrics, I learned how much goes into thoughtful data collection and governance. This experience has laid an important foundation for WCA to help us capture and tell our story as we grow."
- Heidi Schell, Director of People Operations
Connecting the Dots Across Three Programs
Where they started: FACES runs three interconnected programs (Early Childhood, Family Support, Workforce Development), but their data lived in three separate systems with no shared narrative.
What they built: A quarterly board dashboard that replaced hours of manual work in Excel and Canva. They organized KPIs under the dimensions of their impact framework (Who, What, Quality, Better Off, Community Contribution) to make the link between outputs and impact visible.
What changed: Board meeting prep dropped from three hours to one. The Evaluation & Learning team can now tell one connected story across all three programs instead of three separate ones.
"One of the biggest benefits of the cohort is having connections with other community-based organizations in the Bay who are also learning how to measure impact through their work. I feel lucky to be part of a cohort that offers this type of shared learning."
- Laura Preuss, Evaluation & Learning Manager
Standardization as a Superpower
Where they started: Departments tracked data independently using inconsistent spreadsheets. No one could answer a basic question about program health without manual digging.
What they built: A centralized dashboard that gives the whole team one shared view, built on standardized data collection.
What changed: One trusted source of truth. Staff no longer need to manually compute updates, which freed up time to ask better questions and refine programs instead of just reporting on them.
"The best part of the cohort is collaborating! It is so great working across teams and breaking the barrier between nonprofits and funders."
- Brennan Jung, former Development Associate
From Silos to Public Transparency
Where they started: Impact data lived in silos with no clear owner and no reliable way to keep it current.
What they built: Their first live, organization-wide dashboard. This year, they also moved their entire annual impact report into UpMetrics and shared it publicly with donors, families, and community members.
👉 View The Arc San Francisco's 2025-2026 Annual Report, built in their UpMetrics dashboard.
What changed: One trusted source for impact data across programs, communications, and development. Teams that used to pull separate figures now work from the same numbers.
"The cohort forced us to work differently. We now have more defined metrics that the full team has agreed on, and we are confident in the story the numbers in our dashboard are telling! We are very grateful for the opportunity to have been chosen to be in the first Bay Area cohort, the collective knowledge is invaluable, and we are very proud of this year's annual report thanks to our incredible dashboard."
- Melissa Ferrer, Development Manager
The Truth about Transformation: You Can't Build Better Data Systems Without Better Relationships
Different organizations, different starting points, same pattern: the fewer barriers between data and the people who need it, the more useful that data becomes. But that technical transformation was only half the story.
The other half was harder. Funders and nonprofits had to learn to trust each other enough to be honest about what wasn't working. Making that happen meant nonprofits showing up with their messy reality: spreadsheets with no consistency, data that lived in someone's head, systems that hadn't been updated in years. And funders willing to sit with that messiness, help solve it, instead of using it as judgment.
Once that safety existed, the technical work became possible. Organizations could think clearly about what they needed to measure. Teams could rebuild dashboards more than once as they learned. Some shifted from "we'll report on this next year" to "we're looking at this every quarter."
Data isn't powerful just because it's accurate, though accuracy matters. It becomes powerful when people trust it, can get to it easily, and actually use it to make decisions. And the reason those dashboards got used wasn't just because they were better tools. It was because they were built by people who trusted each other. That trust made people confident in the data, willing to act on it, and committed to keeping it current.
Christine Walther Tripp, Executive Director at The Walther Foundation, one of the five funders of the Bay Area cohort, reflected on watching this unfold:
"I kept thinking to myself: 'This is what I always hoped philanthropy would FEEL like.' And I think it is what we all want it to feel like. Profound connection, partnership, honesty, trust. And a commitment to excellence and change, to making the world a better, safer place for all. This is the kind of collaboration that will keep all of us energized and enjoying our work, rather than burning out. It is a really really big deal."
That safety is what allowed the organizations in this cohort to do the hard lifting. It's why they kept showing up through frustration and exhaustion. It's why they could laugh together when they found yet another spreadsheet hidden in a folder. And it's why their dashboards became living tools instead of compliance artifacts.
The technical transformation was real. But it rested on something more fundamental: a culture shift in how funders and nonprofits can work together. Both had to happen. Neither worked without the other.
What Comes Next
The Bay Area cohort is complete, but the work continues. All of the cohort participants have access to the UpMetrics Community, our peer learning platform where they can keep collaborating, asking questions, and taking on-demand training. Several are also preparing to share what they learned with peers and funders.
For UpMetrics, this cohort confirmed that the bottleneck isn't usually software. It's insights, collaboration, and trust. Nonprofits need the space to define what matters, build the right systems, learn alongside peers who are solving similar problems, and work with partners they can trust. And they need tools that make all of that easier, not harder: tools that surface insights and enable collaboration so the real work can happen.
Interested in bringing a cohort experience to your grantees, or joining a cohort yourself? Add your name to our interest list.

%20-%20no%20button.png?width=1080&height=1200&name=Stories%20CTA%20Banner%20-%20Book%20a%20Demo%20(Vertical)%20-%20no%20button.png)